Copyright © 1995-2001 MZA Associates Corporation
Runset Monitor Overview
The tempus Runset Monitor is a standalone program that allows the user to continuously monitor the state of a simulation runset. It consists of several display sections to view the progress, time, and disk space information, in addition, it has an optional control bar and an optional message window. The control bar provides buttons to skip the next run or pause the execution of the simulation, while the message window can be used to track, display, and save log, error, and warning messages including the present context.
User's Guide
The following links describe the features of the Runset Monitor:
Software configuration and requirements
The tempus Runset Monitor was written for the Windows98\2000\NT environment using the MS Visual C++ 6.0 compiler. Files needed for the monitor program are the executable file trm.exe and the configuration file trm.cfg both located in the <TEMPUS_DIR>\bin\<MSVC_VERSION> directory. The help file trm.htm and its associated jpg image files are located in the C:\MZA\doc\trm directory. Necessary dll files which must be installed into the \Windows\System32 or \WinNT\System32 directory are mfc42.dll, msvcrtd.dll, and msvcirtd.dll. The configuration file stores the path to the help files and up to 10 runset names that were used during the last sessions.
The Runset Monitor can be started by double-clicking on the trm.exe file or by typing trm in a DOS window. Make sure the environment variables <TEMPUS_DIR> and <MSVC_VERSION> have correctly been set. Following command line arguments are available to specify the initial setup:
All command line arguments are position insensitive and, with exception of the runset name, case insensitive. When submitting a runset name without the ending .trf or .smf, the program first checks if an executable corresponding to the runset name exists in the current directory. If the program finds the executable it will use the next available runset test name (i.e. runset name extended by a number) to connect to the simulation. Otherwise, the runset name itself (without the .trf or .smf ending) will be used to connect to the simulation.
The runset monitor employs a shared memory file to connect to a simulation runset and exchange progress data and control commands. This shared memory file is created by the simulation runset and its name is equal to the name of the new data trf file (without the .trf ending), also created by the simulation at startup. In order for the monitor to connect to a simulation runset, the correct name of the shared memory file has to be submitted.
|
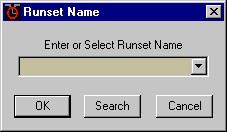
The runset to be monitored can be defined or changed at any time by clicking on the button next to its name field and selecting/entering the shared memory file name in the popup dialog. Up to 10 previously submitted names will be stored and can be selected in the dialog list box. In case the exact shared memory file name is unknown, one can click on the Search button to look for and select the desired trf file. If the monitor cant connect to the selected runset file, an error message will be printed to the status field and the program will periodically try to connect again. The runset name dialog is accessible in the Summary and Runset display section and in the View menu under Select Runset. |
The runset name can also be defined during startup as a command line argument by either submitting the shared memory file name or the runset simulation name itself.
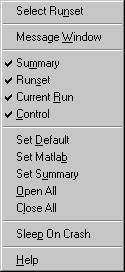 |
The Runset Monitor has several display sections which can be opened or closed in the View menu. To access the View menu right-click on the monitor window outside any display field, or right-click on the window name bar to bring up the system menu which has a link to the View menu. The following display sections are available:
|
In addition to each individual display section, following predefined display sets can be selected using the View menu:
If no valid runset has been selected, the monitor information fields will be blank. When all display sections are closed one can access the View menu through the system menu by right-clicking on the window name bar.
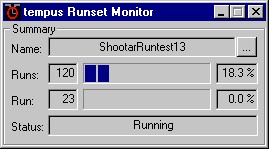 |
The Summary section presents a brief overview of the state and progress of the simulation runset. It includes the runset name, the number of runs, the current run being processed, the progress of the current run, the overall progress, and the status of the runset. |
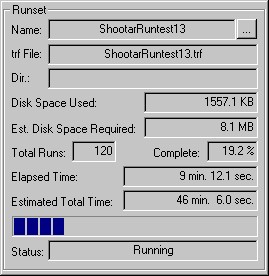 |
The Runset section shows all information pertaining to the runset itself. The following information is reported: the runset name, the number of runs, the current status and progress of the runset, the elapsed time and estimated total time, the name and location of the simulation output trf file including the current disk space used and estimated disk space required. |
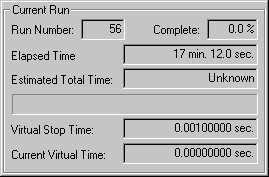 |
The Current Run section displays the information specific to the current run in progress. It includes the current run number, the progress of the current run, the elapsed time and estimated total time, the current virtual time and the virtual stop time. |
![]()
The Control Bar consists of three buttons:
The control buttons are enabled if the right conditions are met and are disabled if no valid runset has been selected.
The Message Window traces the log messages, and possible warning and error messages, along with the current context of the simulation runset. The context and messages are displayed in separate fields and are updated every 0.1 second. The Context field displays always the newest context and can be set to either show the top or the bottom view using the double arrow buttons aside its vertical scroll bar. The Logs field contains up to the last 100 log messages and the Warning/Error field contains up to the last 50 error and warning messages, both always showing the most recent message on top. For each log, error, or warning message its corresponding context can be displayed by left-double-clicking on the message. This will pause the display which can be restarted by left-clicking in the Context field or by pressing the Go button. The display can also be paused independently by pressing the Pause button. In addition to tracing the messages, the Message Window continuously displays the current virtual time and updates the total time and total memory used whenever the context level decreases. A Status field shows the current state of the runset and possible lost messages are counted and displayed in the Messages Missed field.
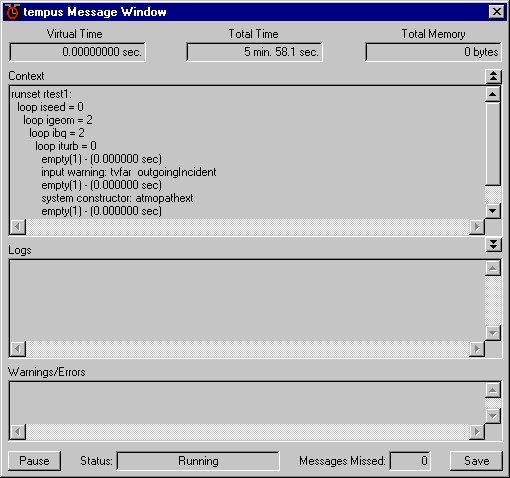
The Message Window also provides a message buffer which the user can flush to a selected file using the Save button. The default size of the buffer is 50000 messages but the size can be defined using the command line argument at startup. If the buffer size is set to 0, no messages are buffered and the Save button is disabled. This can reduce the CPU time taken up by the Monitor program when processing a large amount of messages, thus leaving more time for the actual simulation process.
For debugging purposes, the simulation can automatically be halted when an error occurs by setting the Sleep On Crash flag in the View menu.
When the Message Window is closed or a new runset is selected all data, including the message buffer, is deleted. Messages are only tracked and processed when the Message Window is open.